Creating awesome Gantt charts for your PhD timeline

It’s a common scenario: you have never heard about Gantt charts. Then, when writing a PhD application or planning your PhD timeline for the upcoming years, someone suggests: You should include a Gantt chart! No need to worry. Here is all you need to know about Gantt charts for your PhD timeline.

What are Gantt charts?
Why are gantt charts frequently used for phd timelines, what information is included in gantt charts for phd timelines, creating a phd timeline gantt chart in microsoft excel, creating a phd timeline gantt chart in microsoft powerpoint, creating a phd timeline gantt chart in a microsoft word, creating a phd timeline gantt chart with an online tool, best gantt chart template for phd timelines in microsoft excel, best gantt chart template for phd timelines in microsoft powerpoint, best gantt chart template for phd timelines in microsoft word, gantt chart phd timeline example in microsoft excel, gantt chart phd timeline example in microsoft powerpoint, gantt chart phd timeline example in microsoft word.
A Gantt chart is a visual representation of a project schedule and a widely used tool in project management.
Gantt charts belong to the family of bar charts. In a Gantt chart, bars depict different project tasks. The length of each bar is proportionate to the task duration and indicates both start and finish dates.
Gantt charts are named after Henry Gantt. He lived from 1861-1919 and developed these types of charts as part of his work as a management consultant.
A Grantt chart is a great way to provide an overview of project tasks, activities and milestones.
Gantt charts are frequently used to illustrate PhD timelines because doing a PhD essentially means creating, managing and implementing a project with many components over several years.
Therefore, Gantt charts are popular tools among (aspiring) PhD students.
They are often featured in PhD proposals: Through visual representations, Gantt charts help communicate milestones, plans and estimated task durations.
Furthermore, Gantt chart PhD timelines allow PhD students to track their progress. They can also help PhD students to stay on track with their work.
You may also like: How to develop an awesome PhD timeline step-by-step
Gantt charts can include all kind of information, based on the specific project they are focusing on. When it comes to Gantt chart PhD timelines, there are several elements that are commonly featured:
- Extensive PhD proposal/plan
- Data collection
- Experiments
- Data analysis
- Writing plan
- Publications
- Conferences
- Courses/Coursework
Of course, every PhD project is unique. This uniqueness should be reflected in your Gantt chart. For instance, your Gantt chart PhD timeline will look different if you write a PhD based on articles or if you write a monograph .
For a PhD based on published articles, different bars in a Gantt chart PhD timeline could for example represent individual papers. For a monograph, it may be smarter to focus on research stages.
How do you create a Gantt chart for your PhD timeline?
Unfortunately, creating a Gantt chart in Microsoft Excel is far from straightforward as Excel does not provide its own Gantt chart template.
You can create a table, turn it into a bar chart and manually edit it until it looks like a Gantt chart. If you have some experience with Excel, it is doable. Detailed instructions on the process can be found in this manual from Ablebits.com.
However, why go through all the hassle when you can simply download a template? You can use Microsoft’s own free Gantt project planner template and adjust it to your PhD project.
Manually creating a PhD timeline Gantt chart in PowerPoint is a bit easier than in Excel. Therefore, I will explain the process here.
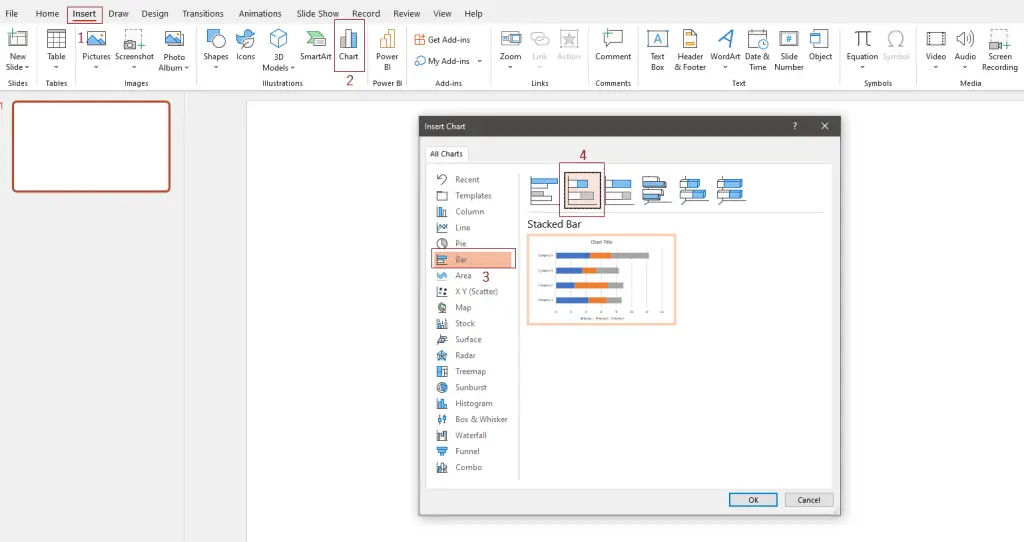
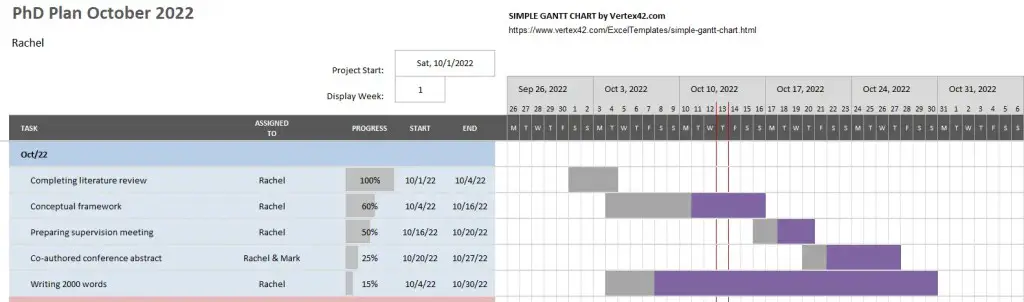
First, you need to open a blank PowerPoint slide. Then click on Insert (1.), then Chart (2.). A popup will appear. Select Bar (3.) and finally select the Stacked Bar option (4).
A standard bar chart will appear on your slide and a small Excel table with open next to it. The first column in the Excel table is called Categories . You can replace categories with the PhD tasks that you want to display. For instance, Literature Review, Interviews, Transcribing and Analysis. You can add more categories or delete existing ones by removing a row in the small Excel table.
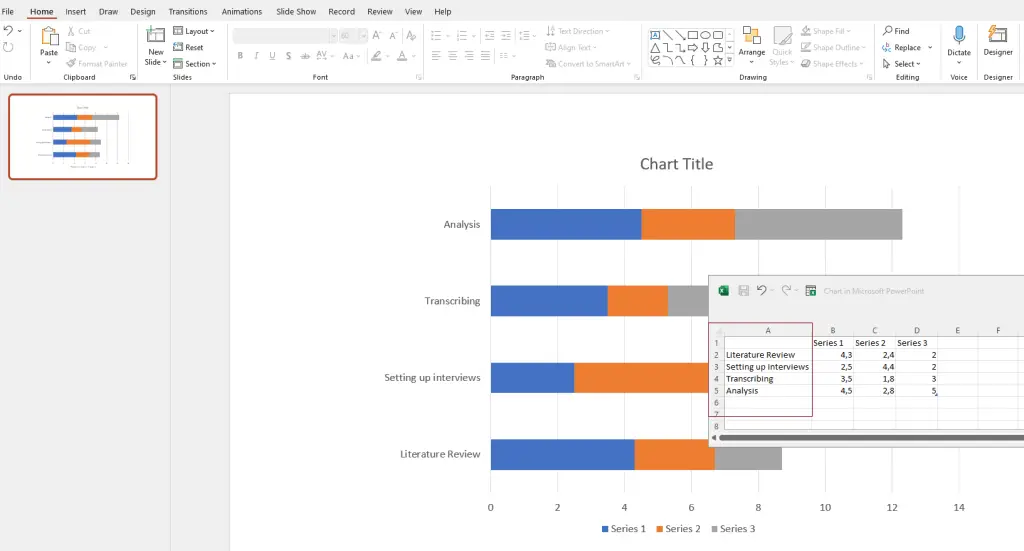
Next to the Categories (now tasks) column, you see three more columns: Series 1 , Series 2 , Series 3 . You can use these columns to showcase the length of tasks. Rename Series 1 into Start Date and Series 2 into End Date . Series 3 indicates the overall length. Depending on the timeframe you want to showcase, you can opt for instance for Length (weeks) or Length (months) .
In the example below, I decided to plan PhD tasks for a year. Thus, 1 means January, 2 means February, 3 means March and so forth. The length of tasks is also indicated in months:
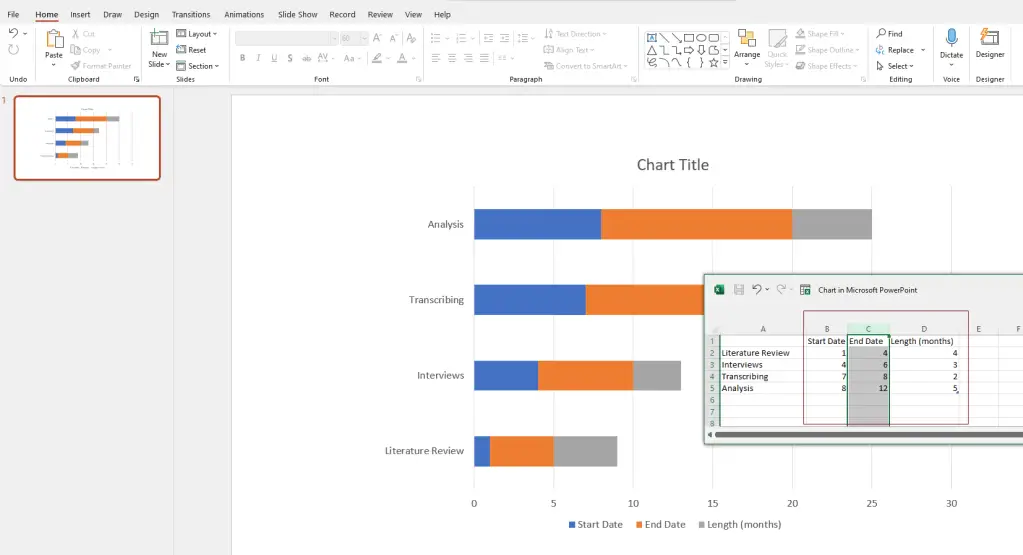
Next, click on your chart and three icons will appear in the upper-right corner next to it. Click on the bottom one, the Chart filters , remove the tick of the check box of End Date , and click on Apply. You will see that the bar chart will start to look like a Gantt chart:
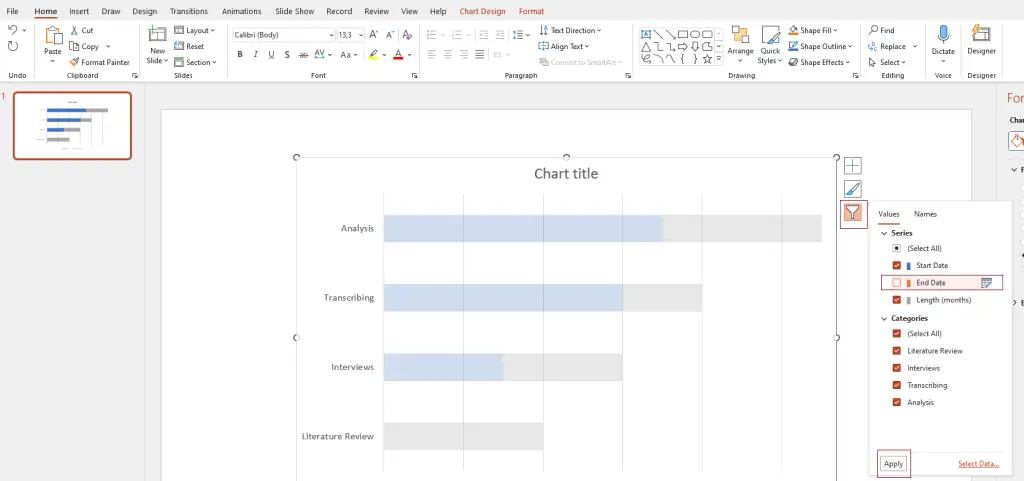
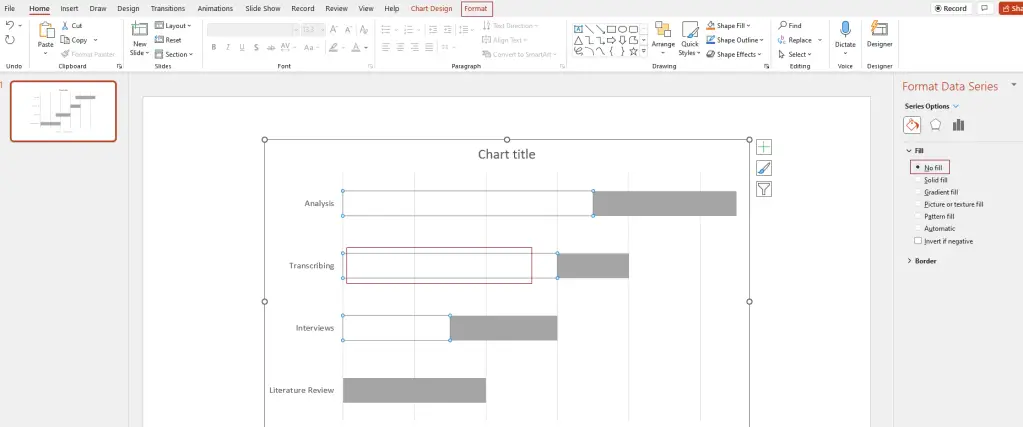
Now, the blue parts of the bar, indicating the Start Dates, need to be removed. Just click on one of them, and on the righthand side, Format Data Series should appear. Select No fill. Alternatively, in the upper menu, select Format , go to Shape fill, and select No fill .
Now comes the fun part, namely decorating. You can add a chart title, colour the bars in the colour of your choice, edit the legend and the axis descriptions. Just play with it to explore the options.
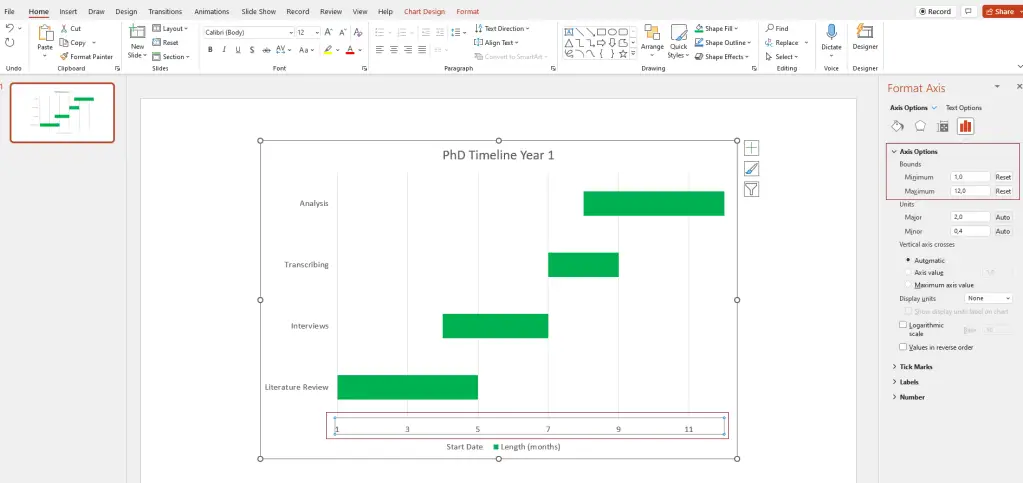
One more thing I did was changing the value of the axis, because I want to illustrate the months of a year. Thus, it was a bit weird that the horizontal axis started with 0 and ended with 13 while I needed 1-12 to indicate each month of a year. You can simply change this by clicking on the axis. On the righthand side, Format Axis will appear. Go to Axis Options , Bounds , and enter 1 for Minimum and 12 for Maximum .
And voila! Your Gantt chart is ready.
The nice thing about learning how to create a Gantt chart in Microsoft PowerPoint is that you basically teaches you how to create one in a Word file as well! The process is very similar.
To start the process in Word, it is smart to first change the orientation of your page to Landscape . In the top menu, click on Layout , then select Orientation , then choose Landscape .
Next, select Insert , then Chart , and select a Stacked Bar chart again.
A basic bar chart will appear on your page:
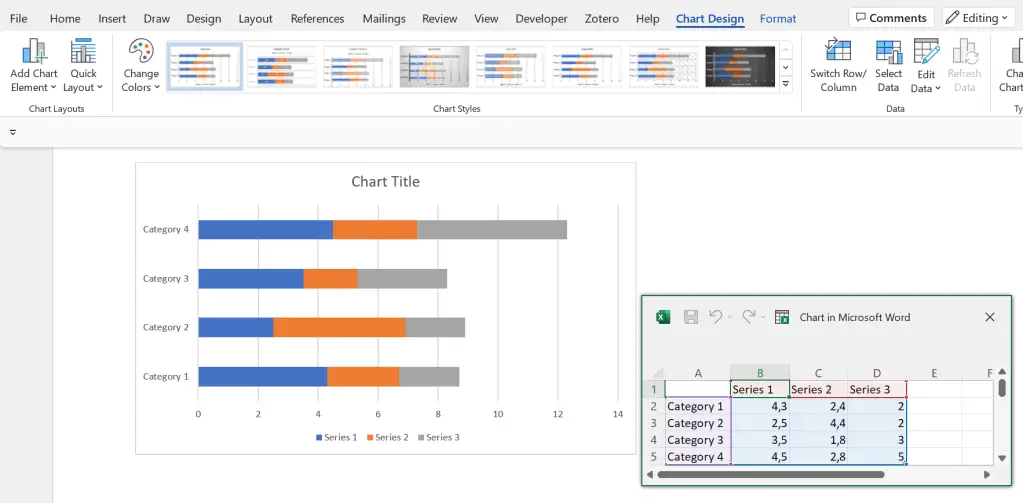
Looks familiar? Yes! From here, it is basically the same process as editing the bar chart in PowerPoint.
If you don’t want to go through the hassle of creating your own Gantt chart but are not convinced by any templates, you can make use of online tools and software.
There are some paid providers out there, but in my opinion, it is not worth paying to create an awesome PhD timeline.
You can use a free provider (or make do with one of the many Gantt chart templates that exist on the internet). One free online tool is the Free Online Gantt Chart Software :
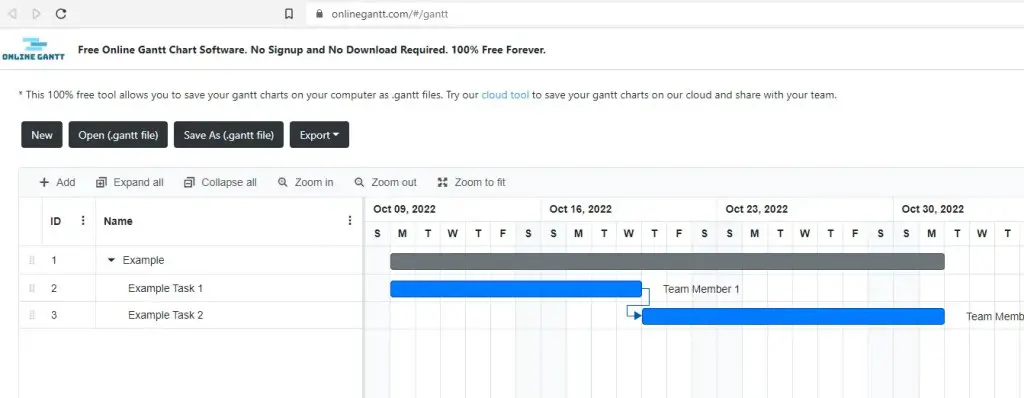
The site requires no signup. You can editing and simply start filling in the Gantt chart, and export it as an Excel, Image or PDF file when you are done!
PhD timeline Gantt chart templates
A great way to create a detailed Gantt chart in Microsoft Excel is by using Microsoft’s free Gantt project planner template . The level of detail and functionality exceeds those of simple, manually created Gantt charts. This makes this type of Gantt chart especially useful to track detailed PhD progress.
A useful Gantt chart template for PhD timelines in PowerPoint can be downloaded here via OfficeTimeline.com This Gantt chart is particularly great to provide a rough overview of plans over a longer period. For instance, with a few edits, you can illustrate a nice 3-year PhD timeline.
Useful Gantt chart templates for Microsoft Word can be downloaded here from TemplateLAB. I like these templates as they can be easily adjusted to the needs of a PhD timeline. For instance, a weekly Gantt chart template can be useful to establish a detailed plan with weekly objectives to keep your PhD progress on track.
PhD timeline Gantt chart examples
Using the template provided by Microsoft above, an example PhD timeline to track regular progress on tasks could look, for instance, like this:
Using the Gantt chart PowerPoint template by OfficeTimeline.com above, an example PhD timeline to present a plan for a 3 year PhD could look, for instance, like this:
Using a weekly Gantt chart template from TemplateLab mentioned above, an example PhD timeline with weekly tasks and objectives could look, for instance, like this:
Get new content delivered directly to your inbox!
Subscribe and receive Master Academia's quarterly newsletter.
10 reasons NOT to do a master's degree
9 smart questions to ask a professor about graduate school, related articles.

Reviewer comments: examples for common peer review decisions

Types of editorial decisions after peer review (+ how to react)

Public speaking in academia and how to practice it

Reject decisions: Sample peer review comments and examples
Gantt Chart for a Research Project Proposal: Step-by-step guide

In project management, there are few tools as effective and illuminating as the Gantt chart . This simple yet powerful visual tool is invaluable for anyone overseeing a complex task, including research project proposals. It is particularly beneficial in the early stages of a project, where meticulous planning is required to ensure that all elements of the project are understood, accounted for, and scheduled appropriately. Therefore, whether you're an academic researcher, a project manager in a corporate setting, or even a student planning your thesis, understanding how to create and use a Gantt chart can be a significant asset.
What is a Gantt Chart and what is it used for?
A Gantt chart, named after its creator, Henry Gantt, an American mechanical engineer and management consultant, is a type of bar chart that visually represents a project schedule. It was first developed in the early 20th century and has since become a staple in project management across various fields and industries. Today, it's used by project managers in sectors like construction, software development, research and development, and more.
At its core, a Gantt chart consists of two main components: tasks and time. The tasks related to the project are listed on the vertical axis, while the horizontal axis represents time. Each task is represented by a horizontal bar, the length of which corresponds to the duration of the task.
Make your own Gantt chart in Gleek .
Gantt charts are incredibly useful for planning and scheduling projects, tracking progress, and managing dependencies between tasks. They provide a clear visualization of the project timeline and help to identify potential bottlenecks and overlaps. This makes them an ideal tool for coordinating teams, allocating resources, and keeping stakeholders informed.
The versatility of Gantt charts solves numerous problems faced by project managers. They simplify complex projects by breaking them down into manageable tasks and visualizing their sequence and duration. This can help in avoiding over-scheduling, underestimating deadlines, and mismanaging resources.
Whether you're a seasoned project manager or a student working on a research proposal, mastering the use of Gantt charts can significantly streamline your project planning process and enhance your team's productivity.
Components needed for Research project proposal diagram
Creating an effective research project proposal diagram requires several key components. These elements provide a comprehensive overview of the project, including its timeline, tasks, and significant milestones.
Project Stages: Each stage of your research project should be clearly defined. This can include the literature review, methodology development, data collection and analysis, results compilation, proposal drafting, peer review, and final edits.
Timeline: The timeline provides a visual representation of the project's duration. It should outline the start and end dates of the project, as well as the estimated completion time for each stage.
Tasks: Each task within the project stages should be clearly outlined. This includes what needs to be done, who is responsible for it, and when it should be completed.
Milestones: Milestones mark significant achievements or phases in your project. These can help track progress and ensure that the project is moving forward as planned.
Dependencies: Dependencies show the relationship between different tasks. It's crucial to highlight how the delay in one task can impact others.
Status: The status of each task and stage helps monitor the project's progress. It can indicate whether a stage is completed, in progress, or yet to start.
Notes/Comments: Any additional information, observations, or feedback about the project can be included here. This could be insights gained during the research, changes made to the project plan, or issues that have arisen.
By incorporating these components into your diagram, you can create a well-structured, transparent, and efficient project proposal.
Creating a Research project proposal Gantt chart using the Gleek App
Step 1: launching gleek and selecting 'new diagram'.
First, launch Gleek.io in your web browser. Once you're in, select 'New Diagram' from the options available. In the diagram type, choose 'Gantt'.

Step 2: Defining Research Goals
The research project initiates with an active phase dedicated to defining research goals, which commenced on December 15, 2023, lasting for a week. This phase involves brainstorming, outlining objectives, and establishing the research's overarching scope.

Step 3: Literature Review Phase
Transitioning to the next stage, we have the completed 'Literature Review' phase spanning two weeks. This phase entails an in-depth analysis, sourcing relevant publications, synthesizing existing knowledge, and aligning it with the predefined research goals.

Step 4: Methodology Design Phase
Progressing to the 'Methodology Design' phase, currently active for three weeks, this stage intricately structures the research approach. It involves designing methodologies, frameworks, and strategies based on insights gleaned from the literature review, ensuring a robust research plan.

Step 5: Data Collection Phase
Following the planning stages is the critical 'Data Collection' phase, slated for four weeks. This phase involves meticulously gathering and assembling primary data, employing various methodologies such as surveys, experiments, or interviews, aligning with the established research framework.

Step 6: Data Analysis Phase
Post-data collection, the active 'Data Analysis' phase spans three weeks. This phase engages in thorough data examination, statistical analysis, and deriving insights from the accumulated information. It involves identifying patterns, correlations, or trends relevant to the research objectives.

Step 7: Results Compilation Phase
Subsequently, the 'Results Compilation' phase consolidates and organizes the analyzed data over two weeks, presenting it in a coherent format. This phase involves preparing comprehensive reports, graphs, or summaries, showcasing the findings derived from the data analysis stage.

Step 8: Drafting Proposal Phase
Advancing further, the active 'Drafting Proposal' phase, extending over three weeks, involves crafting the research proposal. It includes outlining the research problem, detailing methodologies, and structuring a cohesive proposal aligned with the project's objectives.

Step 9: Peer Review Phase
Upon completion of the draft, the two-week 'Peer Review' phase gathers insights and constructive feedback from peers or subject experts. It involves peer evaluations, discussions, and recommendations aimed at refining and enhancing the proposal's quality.

Step 10: Final Edits
Finally, the one-week active 'Final Edits' phase focuses on meticulous revisions, addressing feedback, and ensuring the proposal's completeness, accuracy, and compliance with set standards. This stage includes proofreading, formatting, and polishing the final document.

Step 11: Proposal Submission Milestone
The 'Proposal Submission' milestone, set for May 15, 2024, marks the conclusive stage, signifying the submission of the crafted and refined research proposal for evaluation and potential implementation.

Hurray, You Did It!
And there you have it! Your Research Project Proposal Gantt Chart is now complete.

This comprehensive diagram, with its clearly defined stages, tasks, timeline, dependencies, resources, and status, provides a holistic view of your research project. It not only serves as a visual representation of the entire project but also acts as a roadmap guiding you from the initial brainstorming phase to the final proposal submission. Utilizing such a diagram can greatly enhance your project planning and execution, ensuring all aspects are considered, dependencies are taken into account, and milestones are tracked. It fosters better coordination, communication, and understanding among team members, leading to more efficient and effective project management.
About Gleek.io
Gleek.io is a powerful tool that can further enrich your project planning needs. It's an intuitive app designed to help you visualize complex ideas, processes, and systems through various types of diagrams. Whether you need to create a flowchart, UML diagram, or even a Gantt chart like the one we've just built, Gleek.io makes the process straightforward and hassle-free.
With its keyboard-centric approach, Gleek.io allows you to create diagrams faster than traditional drag-and-drop tools. You can quickly jot down your ideas and see them evolve into structured diagrams in real-time, making it an ideal tool for brainstorming sessions, project planning, and presentations.
In conclusion, Gleek.io is more than just a diagramming tool. It's a platform that enables you to visualize your thoughts, communicate complex ideas simply, and manage your projects more effectively. Give it a try for your next project and experience the difference it can make!
Related posts
Beyond Traditional Planning: Top Gantt Chart Alternatives in 2024
Gantt chart critical path explained
Pert vs. Gantt Charts: Choosing your project's blueprint
back to all posts
A PhD timeline for finishing quickly [Free Gantt Download]
Navigating the labyrinthine journey of a PhD program is no small feat.
From the day you step into your graduate program as a bright-eyed doctoral student, you’re immediately thrust into a complex weave of coursework, research, and milestones.
By the second year, you’ve transitioned from coursework to research, laying the groundwork for your dissertation—a pivotal component in your scholarly endeavour.
Come the third year, you face the critical oral examination, a hurdle that could make or break years of hard work.
But how does one streamline this multifaceted journey? The answer lies in a well-planned PhD timeline.
This blog serves as an invaluable guide for any PhD student looking to complete their doctoral studies efficiently, walking you through each milestone from coursework to graduation.
How to Begin with the PhD Timeline Planning?
Planning your PhD timeline is an essential first step in your PhD program.
Success in any PhD program depends, to a large extent, on effective time management and keeping track of progress through a thoughtfully crafted PhD timeline.
Start with outlining all your major requirements:
- coursework,
- dissertation,
- and the expected time needed for each task.
I also highly recommend factoring in failure time – give yourself a little bit of wiggle room for when things, invariably – go wrong.
It’s crucial to remain realistic about the time you can commit daily or weekly while keeping long-term goals in mind.
Regular check-ins on your PhD timeline and supervisor will help you stay on track and allow you to adapt if necessary.
Adjustments may be needed as you progress through your PhD program, but having a timeline as a guide can make the journey less daunting and more achievable.
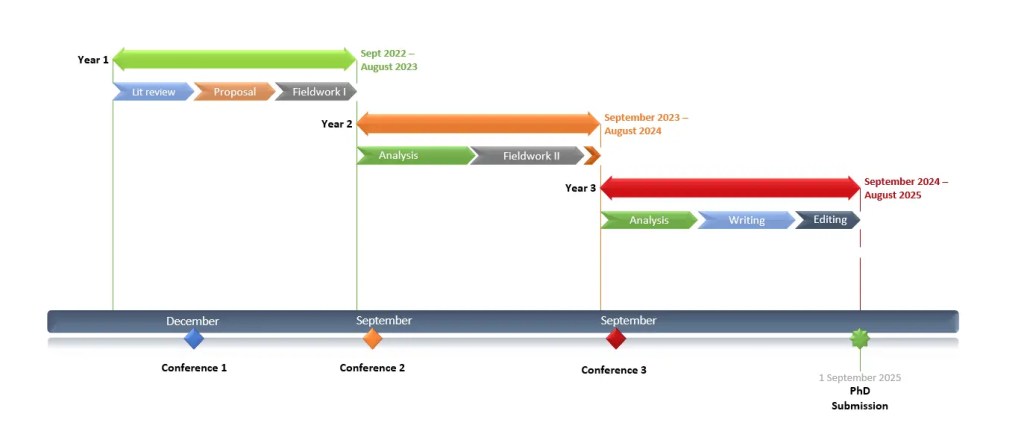
Elements to include in a 3-year PhD timeline
The initial stage in this timeline typically involves coursework, often lasting one year, where the student engrosses themselves in advanced study in their chosen field.
Once the coursework is done (USA PhDs), they focus on proposing, conducting, and presenting their initial research.
By the end of the second year, most students should have a clear direction for their dissertation, a core component of the PhD process.
In this third and final year of the PhD timeline, the student focuses primarily on completing their dissertation, which involves collecting data, analyzing results, and organizing their research into a substantial, original, and cohesive document that contributes to contemporary knowledge in their field.
Regular reviews and modifications of the PhD timeline may also be necessary to accommodate various unpredictable circumstances, thus making this timeline both a guide and a flexible workplan.
It is a significant tool in successfully navigating the maze of becoming a PhD holder.
Create Your PhD Timeline for a 3 year completion
Creating a timeline for a 3-year PhD program requires careful planning, as you’ll have multiple milestones and tasks to complete.
This timeline may vary depending on your specific field, institution, or country, but here is a general outline you can use as a starting point:
Free Gantt chart excel template
Here is a free template you can modify for your own research:
Example Gantt chart for a USA PhD
Here are some common steps involved in completing a PhD, which I’ll use to create the Gantt chart:

- Orientation and Coursework (Semester 1) : Familiarization with the university, department, and coursework.
- Coursework (Semester 2) : Continued coursework and possible teaching/research assistantships.
- Select Advisor and Research Topic : Usually done towards the end of the first year or the beginning of the second year.
- Preliminary Research : Initial research and literature review.
- Complete Coursework (Semester 3) : Wrap up any remaining required courses.
- Research Proposal : Develop a full research proposal including methodology.
- Qualifying Exams : Exams to transition from a Ph.D. student to a Ph.D. candidate.
- Begin Research : Start of actual research based on the approved proposal.
- Conduct Research : Data collection, experiments, and analysis.
- Intermediate Review : A review to assess the progress of the research.
- Write Papers : Start writing papers and possibly publishing in journals.
- Finalize Research : Final experiments and data analysis.
- Write Dissertation : Writing the actual Ph.D. dissertation.
- Dissertation Defense : Defending the dissertation before the committee.
- Graduation : Completing all requirements and graduating.
Example Gantt chart for a UK, European and Australian PhD
For Ph.D. programs outside the United States, especially in Europe and some other parts of the world, students often go straight into research without the need for coursework. Here are some common steps for such programs:

- Orientation : Familiarization with the university and department.
- Select Advisor and Research Topic : Usually done at the beginning of the program.
Wrapping up
The journey to earning a PhD is complex and demanding, filled with academic milestones from coursework to research to dissertation writing.
The key to a smooth and efficient doctoral journey lies in well-planned time management—a structured PhD timeline.
This blog serves as an invaluable guide, offering detailed tips for planning out each academic year in both U.S. and international PhD programs. It emphasizes the importance of starting with an outline of major requirements and factoring in “failure time” for unforeseen challenges.
For those looking to navigate their PhD journey in three years or beyond, having a flexible but comprehensive timeline can be the compass that guides them successfully through the academic labyrinth.
Whether you’re just starting out or already deep into your research, the principles and strategies outlined here can help streamline your path to that coveted doctoral hood.

Dr Andrew Stapleton has a Masters and PhD in Chemistry from the UK and Australia. He has many years of research experience and has worked as a Postdoctoral Fellow and Associate at a number of Universities. Although having secured funding for his own research, he left academia to help others with his YouTube channel all about the inner workings of academia and how to make it work for you.
Thank you for visiting Academia Insider.
We are here to help you navigate Academia as painlessly as possible. We are supported by our readers and by visiting you are helping us earn a small amount through ads and affiliate revenue - Thank you!
2024 © Academia Insider
5 Types of GANTT Charts for PhD
“GANTT chart is so crucial for PhDs. It helps them to divide, manage and arrange their PhD goals. Universities seek one from every student. So what are those 5 types of PhD GANTT charts that every PhDs need? Let’s find out.”
A doctorate is the highest academic honor that every graduate is willing to achieve. Unfortunately, only some can manage to go for it. The journey of PhD is full of hurdles and hassles that students are often unaware about.
It’s more an honor and thus difficult to achieve too but not impossible, certainly. Scholars often get stuck, fail and eventually drop their PhD, because of the lack of a single basic thing– planning. Every PhD is similar– Everyone has to do research, that’s it.
However, it’s so true that doing research in some fields– like life science and biology or any other STEM subject – is quite hard and lengthy. But the sheer process is the same. Students fail because they fail to structurize their work.
So how can we greatly succeed in our PhD endeavor? The answer is simple— by planning your work– not in mind, on paper actually in your daily life, for a year and the entire tenure of PhD. That looks nearly impossible, right?
Planning your entire PhD, research work and writing assignments aren’t that difficult. Using a GANTT chart or preparing your own, you can manage all the stuff easily. You can design your goals and track them for your entire PhD.
In this article, I’m gonna explain 5 types of PhD GANTT charts that every PhD student should know about.
Stay tuned.
5 Types of GANTT chart for PhD
36 months gantt chart for phd , phd gantt chart for research , gantt chart for thesis writing , gantt chart for daily schedule, progressive research chart.
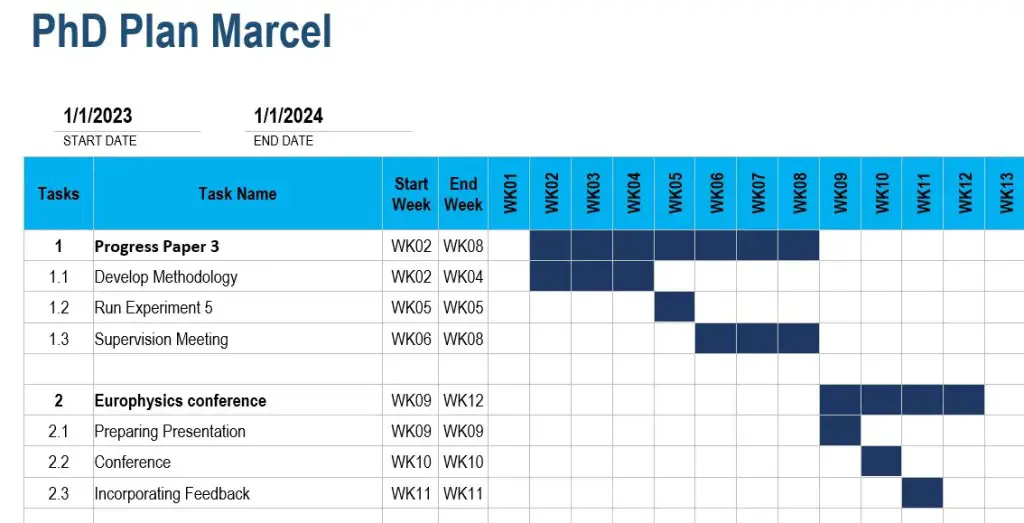
Every scholar must have a 36-months (3-year) GANTT chart for their PhD. And let me tell you that universities also ask for one. So you must have it. Usually, the ideal PhD duration is 3 years, though students can ask for an extension.
Along with their research project, universities ask to submit a fully planned GANTT chart for 3 years. In this planner, you have to enlist all your goals, research work, objectives and progress you would make each month.
You have to decide and draw how much time you would give to each assignment/task. And accordingly, you have to work. Major goals in this chart would be
- Course work
- Pre-research work
- Research work
- Post-research work
- Thesis writing
- Research paper writing
- Thesis submission.
Each goal has an individual task too— For instance, during the pre-research phase one has to prepare their PhD research title, synopsis, and research project and send them for approval. I have enlisted all goals, individual tasks and time required to achieve each in this GANTT template. Download it.
Preparing this chart will help you to monitor, assist and track your PhD progress in a real-time manner. Keep in note that this is a kind of goal-achiever chart, mark each goal as “complete” you achieve.

Research has been such a crucial parameter in PhD. Every research starts with sample collection and ends with data collection. The stepwise process of PhD research included many other important steps.
One trait of research is ‘uncertainty’. Research is a highly unpredictable process, no one, literally– no one can predict the results and define the time frame. However, you have to make a time frame for your research.
Put simply, you have to allot time to every research goal, which certainly increases the probability of maximizing your chances of success. So what should be the process here?
Divide your research process into steps (our previous article will help with this). Understand the importance of each research goal and accordingly allot time. For example, 6 months for sample collection or 3 months for validation, etc.
Then go to the GANTT chart planner and prepare a chart for a research goal against the time required. You can also add other elements like real-time monitoring, color code and progress graph. That’s totally up to you.
Here I have one for you. Please visit it and download it.

This PhD research planner template would increase your chances of success.
Yet another crucial goal of any PhD is thesis writing, and it should progress simultaneously with your research. Meaning, you should have to write in your free time during/while you do lab research.
PhD thesis is a mountainous task of writing 200 pages– structured and organized assignment. Common thesis parts are– the introduction, review of literature, methodology, results and discussion, interpretation and references.
Besides many other things are also included in the thesis, to know more read this article— How to Write a PhD thesis?
As we aforesaid, research is an uncertain process but not writing. You can manage and control your PhD writing assignments by only preparing a single GANTT chart. Note that writing for PhD takes a huge proportion of your time.
So planning for writing a thesis is crucial too. Prepare a chart for thesis writing goals against the time required– For instance, 2 months for introduction, 7 months for review of the literature and so on.
Give each writing goal a different color and monitor the progress. Check out this GANTT chart for more detail.

What is the ultimate goal of any research scholar? To achieve the PhD degree, right? No. it’s to achieve the PhD degree in a given time. I.e. in three years. Hence, to complete such a huge task in a given time frame you have to manage things at a micro-level.
Zero-date planning and micro-management help you to get success in a quick time. Now, you may wonder how it’s possible. The simple answer is by planning every day, 365 days of the year 1,095 days of the entire tenure.
My ultimate advice to every PhD student who wishes to succeed in their research is to prepare and manage your daily schedule. The importance of a daily schedule and how to manage it is explained in our previous article, here it is— What should be a daily routine for PhD Students? Our proven checklist .
Plan your day on an excel sheet in the form of a GANTT chart. Try hard to follow it every day and you would see magical results in the long run. Daily planning (using this simple GANTT chart) helps every one of our PhD research students.
Prepare your daily schedule– activities you are doing, want to do and you have to do, give it a specific time and stamp it in the form of a chart. The fun part is you can use different colors to track your activities.
For example, Read if fails to achieve a goal or green for achieved goals. Take a quick look at one of my student’s GANTT daily charts.

Every PhD should have a progressive research chart there on their PhD. You have to lead it and apply to monitor how much progress you have done in your semester or in a year. It’s progressive means you have to update your goals, otherwise, it will consider it as “failed” and mark it as unachieved.
I plan to prepare one progressive and real-time chart, when you set a start and end date, it starts the tik-tik toward a deadline. I will update it later in this article.
Wrapping up
After reading all these, you wonder if it’s difficult to prepare all this stuff and manage. Let me tell you that you do not need to waste your time on such things. Just focus on your research. We already have “ready-to-use templates” in a single place.
Please visit this page to access a single or all GANTT chart. You can use it. I hope you like this article. Please share it and don’t forget to check out our templates.

Dr. Tushar Chauhan is a Scientist, Blogger and Scientific-writer. He has completed PhD in Genetics. Dr. Chauhan is a PhD coach and tutor.
Share this:

- Share on Facebook
- Share on Twitter
- Share on Pinterest
- Share on Linkedin
- Share via Email
About The Author
Dr Tushar Chauhan
Related posts.

10 Amazing Benefits of GANTT chart for PhD

How to Prepare a GANTT chart in a Google Sheet?
Leave a comment cancel reply.
Your email address will not be published. Required fields are marked *
Save my name, email, and website in this browser for the next time I comment.
Notify me of follow-up comments by email.
Notify me of new posts by email.
Proposal Template AI
Free proposal templates in word, powerpoint, pdf and more
Gantt Chart Research Proposal Template: A Comprehensive Guide + Free Template Download + How to Write it
A comprehensive guide to gantt chart research proposal template.
As a researcher, one of the essential tools in my arsenal is a well-crafted and organized research proposal . However, I often found that traditional proposal formats lacked a clear and visual representation of the project timeline and tasks. That’s why I turned to Gantt Chart Research Proposal Templates. These templates provide a structured framework for outlining the research scope, timeline, and resources required , all within the context of a Gantt chart. In this article, I will explore the importance of using a Gantt Chart Research Proposal Template , and how it differs from a standard proposal in terms of organization and visualization. So, let’s dive into the world of Gantt charts and how they can revolutionize the way we approach research proposals .
Gantt Chart Research Proposal Template
Title: the impact of social media on mental health, introduction.
The introduction should provide a brief overview of the research topic and its significance. It should also include the research question and objectives.
The growing use of social media has raised concerns about its potential impact on mental health. This research aims to investigate the relationship between social media use and mental health, with a focus on the psychological effects of excessive use and cyberbullying. The objectives of the study are to (1) assess the correlation between social media use and mental health issues, (2) identify the contributing factors to negative mental health outcomes, and (3) explore potential interventions to mitigate the negative impact of social media on mental health.
My advice on the introduction:
Ensure that the introduction clearly states the research question and objectives, and provides a compelling rationale for the study. It should effectively communicate the importance and relevance of the research topic to the audience.
Literature Review
The literature review should present a critical analysis of existing research and theories related to the topic. It should also identify gaps in the literature that the proposed study aims to address.
The literature review will examine previous studies on the relationship between social media use and mental health, including research on the potential psychological impacts of excessive use and cyberbullying. It will also explore theories and frameworks that explain the mechanisms through which social media may influence mental health outcomes. The review will highlight the gaps in the current literature, such as the need for more longitudinal studies and the exploration of potential interventions to promote positive mental health in the context of social media use.
My advice on the literature review :
Ensure that the literature review is comprehensive and critical, providing a synthesis of existing knowledge and identifying areas for further investigation. It should also demonstrate the theoretical and empirical foundation for the proposed study.
Methodology
The methodology section should outline the research design , data collection methods, and data analysis techniques . It should also provide a timeline for the proposed research activities.
This study will utilize a mixed-methods approach, combining quantitative surveys and qualitative interviews to gather data on social media use and mental health outcomes. The survey will be administered to a representative sample of social media users, while the interviews will involve individuals with personal experiences related to the research topic. Data analysis will involve statistical techniques for the quantitative data and thematic analysis for the qualitative data . The timeline for the research activities is presented in the Gantt chart below.
My advice on the methodology:
Ensure that the methodology is well-structured and aligned with the research objectives . It should provide a clear explanation of the research design and data collection procedures, as well as a realistic timeline for the proposed activities .
Gantt Chart
The Gantt chart should visually depict the timeline for the research activities, including the duration of each task and the deadlines for completion.
| Task | Duration | Deadline | |—————————-|———–|————-| | Literature review | 2 months | 10/15/2022 | | Survey design and testing | 1 month | 11/15/2022 | | Survey administration | 2 months | 01/15/2023 | | Data analysis | 3 months | 04/15/2023 | | Interview recruitment | 1 month | 05/15/2023 | | Interview data collection | 2 months | 07/15/2023 | | Data synthesis and writing | 3 months | 10/15/2023 |
My advice on the Gantt chart:
Use the Gantt chart to visually organize and schedule the research activities, providing a clear timeline for each task. Make sure to allocate sufficient time for data collection , analysis, and writing, and consider potential delays or unexpected challenges in the research process .
Download free Gantt Chart Research Proposal Template in Word DocX, Powerpoint PPTX, and PDF. We included Gantt Chart Research Proposal Template examples as well.
Download Free Gantt Chart Research Proposal Template PDF and Examples Download Free Gantt Chart Research Proposal Template Word Document
Download Free Gantt Chart Research Proposal Template Powerpoint
Gantt Chart Research Proposal Template FAQ
What is a gantt chart in a research proposal.
A Gantt chart is a visual representation of the timeline for a research project , which lays out the tasks, milestones, and timeframes for completing different aspects of the research.
How can I create a Gantt chart for my research proposal?
You can create a Gantt chart using various software tools such as Microsoft Excel, Project, or specialized project management software. There are also online Gantt chart creators that can help you build a Gantt chart for your research proposal .
What information should be included in a Gantt chart for a research proposal?
A Gantt chart for a research proposal should include tasks, start and end dates, duration of each task, dependencies between tasks, milestones, and responsible individuals or teams for each task.
Can I use a Gantt chart for my qualitative research proposal?
Yes, a Gantt chart can be useful for qualitative research proposals as well. It can help you plan and organize the various stages of your research, from literature review to data collection and analysis.
How detailed should the Gantt chart be for a research proposal?
The level of detail in the Gantt chart will depend on the complexity and duration of the research project. It should be detailed enough to provide a clear overview of the timeline and tasks involved, but not so detailed that it becomes overwhelming.
Is it necessary to include a Gantt chart in my research proposal?
While including a Gantt chart is not always mandatory, it can greatly enhance the clarity and organization of your research proposal . It demonstrates your understanding of the project’s timeline and shows that you have a well-thought-out plan for executing the research.
Can I update the Gantt chart during the course of the research project?
Yes, it’s important to regularly update the Gantt chart throughout the research project to reflect any changes in timelines, tasks, or dependencies. This will help you to stay on track and make adjustments as needed.
Related Posts:
- Research Proposal Template: A Comprehensive Guide +…
- Music Business Proposal Template: A Comprehensive…
- Academic Proposal Template: A Comprehensive Guide +…
- Fundraising Proposal Template: A Comprehensive Guide…
- Project Proposal Template: A Comprehensive Guide +…
- It And Software Proposal Template: A Comprehensive…
- Business Proposal Template: A Comprehensive Guide +…
- Proposal Template: A Comprehensive Guide + Free…
How to write a Research Proposal: Creating a Gantt chart
- Components of a research proposal
- Useful videos
- Common mistakes to avoid
- Sage Research Methods LibGuide This link opens in a new window
- Managing sources
- Request a literature search
- Research proposal - examples
- Creating a Gantt chart
- Free Apps for Research
- Academic writing
What is a Gantt chart
Some University departments require students to create a Gantt chart to represent a schedule for the research project. The Gantt chart shows the timelines of the various steps of the project including their dependencies and any resources needed . In other words, the chart depicts when an event is supposed to take place in your project by providing an outline regarding the order in which the various tasks need to be performed .
An example of a Gantt chart.

Gantt chart on Moodle
How to create a Gantt chart - videos
- << Previous: Research proposal - examples
- Next: Free Apps for Research >>
- Last Updated: Dec 19, 2023 12:35 PM
- URL: https://libguides.unisa.ac.za/research_proposal
IMAGES
VIDEO
COMMENTS
They are often featured in PhD proposals: Through visual representations, Gantt charts help communicate milestones, plans and estimated task durations. Furthermore, Gantt chart PhD timelines allow PhD students to track their progress.
Your Research Project Proposal Gantt Chart is now complete. Make your own Gantt chart in Gleek . This comprehensive diagram, with its clearly defined stages, tasks, timeline, dependencies, resources, and status, provides a holistic view of your research project.
Research Proposal: Develop a full research proposal including methodology. Qualifying Exams: Exams to transition from a Ph.D. student to a Ph.D. candidate. Begin Research: Start of actual research based on the approved proposal. Year 3. Conduct Research: Data collection, experiments, and analysis.
Stay tuned. 5 Types of GANTT chart for PhD. 36 Months GANTT chart for PhD. PhD GANTT chart for research. GANTT chart for thesis writing. GANTT chart for daily schedule. Progressive research chart. 36 Months GANTT chart for PhD. Every scholar must have a 36-months (3-year) GANTT chart for their PhD.
Gantt Chart Research Proposal Template: A Comprehensive Guide + Free Template Download + How to Write it – Proposal Template AI. As a researcher, one of the essential tools in my arsenal is a well-crafted and organized research proposal.
How to write a Research Proposal: Creating a Gantt chart. What is a Gantt chart. Some University departments require students to create a Gantt chart to represent a schedule for the research project. The Gantt chart shows the timelines of the various steps of the project including their dependencies and any resources needed .
How to plan your PhD using a Gantt Chart - downloadable template! The PhD Pensieve. 118 subscribers. Subscribed. 206. 9.3K views 2 years ago #GanttChart #exceltemplate #googlesheets. Hi! This...
How to Propose/Report PhD Research progress with Gantt Charts! #GanttChart #PhDProductivity #PhDTips (long title)MANAGE PHD PROJECTS WITH GANTT CHARTS | In t...